


Table of contents
Charts are one of the best, if not the best, too to use to visualize data. Every developer should be able to use charts in their project. In this tutorial I'm going to show you how to add charts into your project using the library, Chart.js.
Note: This tutorial was made using the latest versions at the time of writing:
- Angular ~13.3.1
- Chart.js ~3.7.1
Getting started
First we'll need to create a new Angular project.
ng new angular-chart-js-tutorial
We'll select no routing and CSS.
Then we'll create a new component for the Chart itself. So navigate into your project file and use use the following command:
ng g c components/chart
I'm using the short hands for generate component and creating a new file for our components.
Once completed, open the project your code editor and navigate to the "app.component.html" file. Once there, replace all the existing code with the following:
<h1>Chart.js Example</h1>

<app-chart>

</app-chart>
Creating the chart
Now let's go to the "chart.component.html" file in the "components" file and add the following code:
<div class="chart-container" style="width: 800px; height: 600px;">
    <canvas id="my-chart">
    </canvas>
</div>
Chart.js, uses the canvas element to draw charts. Now let's switch to the "chart.component.ts" file and add the following imports:
import {Chart, ChartConfiguration, ChartItem, registerables} from 'node_modules/chart.js'
Then we'll create a method and call it in the ngOnInit() method. This method is going to be responsible for creating our chart. Your code should look something like this:
ngOnInit(): void {
    this.createChart()
}

createChart(): void {

}
In createChart(): void method, we'll need to following along some steps. Start by registering the chart.
Chart.register(...registerables);
Now we'll setup the data our chart is going to be using.
const data = {
      labels: ['January','February','March','April','May'],
      datasets: [{
        label: 'My First dataset',
        backgroundColor: 'rgb(255, 99, 132)',
        borderColor: 'rgb(255, 99, 132)',
        data: [10, 5, 2, 20, 30, 45],
      }]
};
Chart.js, also allows us to customise the Chart itself by configuring the options.
const options = {
      scales: {
        y: {
          beginAtZero: true,
          display: false
        }
      }
    }
All these options do is to start the y-axis from zero and hide the y-axis to give a cleaner feel. Once that's completed, we'll configure the chart.
const config: ChartConfiguration = {
      type: 'line',
      data: data,
      options: options
    }
Note the type of chart we'll be creating will be a line chart. You can use other options such as pie, doughnut, bar, bubble etc. For a list of all the types, you can get started here. Now we'll grab the chart item, the canvas on which the chart will be displayed on.
const chartItem: ChartItem = document.getElementById('my-chart') as ChartItem
Finally, we'll create the chart with this final line of code.
new Chart(chartItem, config)
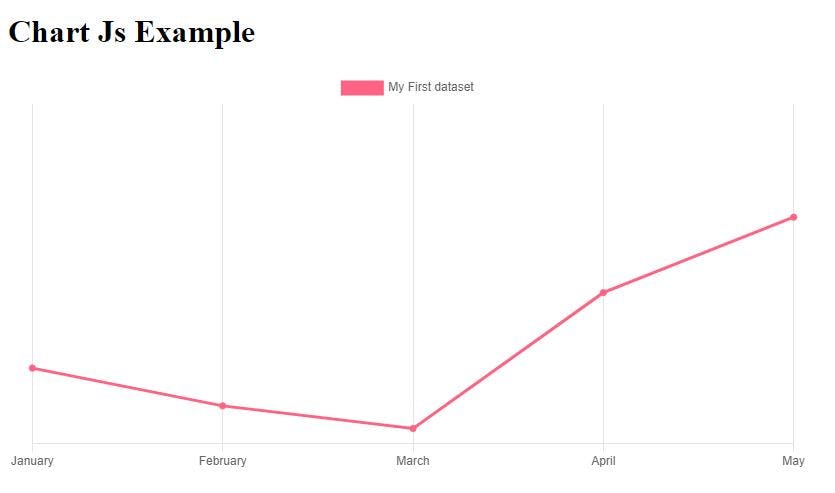
End Result
To view the end result, open up the terminal, type ng serve and navigate to localhost:4200 in your browser once your app startup is completed.
The end result should look something like this
Conclusion
For more details about Chart.js, be sure to check our their website, official repository and be sure to give them a star!
I've also created a repository for you to follow along in case you get stuck.
If you found this post useful, please follow me on Twitter for more Angular and development tips and check me out on GitHub.
Thanks for reading and have a great day! 😄